
A while ago, Simo Ahava and Mark Edmondson described How To Build A Google Tag Manager Monitor. They discussed several solutions, but their choice was Cloud Functions, since it is easy to get the solution quickly up and running.
They did initially consider Pixel Tracking via a Load Balancer, but they found this method less accessible. But as they wrote:
If you do have a custom domain name at hand, the load balancer is probably the most robust solution to utilize, since it doesn’t require the overhead of running a programmed application.
So, this blog post is just more or less a “note to self” about how to do Google Tag Manager Monitoring using Google Cloud Serverless Pixel Tracking via a Load Balancer. Follow the instructions from Simo and Mark up to the headline 3.1.3. Technology of choice: Cloud Functions. Then head back to this blog post, and follow the instructions here. I just stand on the shoulders of the awesome work from Simo and Mark.
Just so I have mentioned it, this setup will have a small cost.
Table of Contents
- 1. Google Cloud setup – Part 1
- 2. Google Tag Manager setup
- 3. Google Cloud setup – Part 2
- 4. Some final words
1. Google Cloud setup – Part 1
I link to all the Google Cloud products used in this blog post. But, if you find it difficult to navigate around in Google Cloud, the perhaps easiest way is to use the Search Field (A), and search for the product.
1.1. Create a Google Cloud Storage Bucket
- Make sure you have selected the correct project. My project is called “Savio – GTM Monitoring“.
- Give your Bucket a meaningful name.

- Choose a Default Storage Class. Since you have chosen to use Serverless Pixel Tracking because of performance, Multi-Regional is your choice. Choose a Location that suit you best. Since I live in Europe, EU is my preferred location.

- Choose how to Control Access to Objects and Set object-level and bucket-level permissions. Skip Advanced settings, and click Create.

- After your bucket have been created, Activate Cloud Shell. You do that from the icon on the right hand side of (5) in the top of your browser, or use the shortcut g then s. We are using Cloud Shell to create our pixel (although you can upload a pixel as well).

- Copy this code, and paste it into Cloud Shell:
1gsutil cp gs://solutions-public-assets/pixel-tracking/pixel.png gs://[YOUR_BUCKET_NAME]
Replace [YOUR_BUCKET_NAME] with the name of the bucket you just created, and hit Enter. If pixel.png was created successfully, close Cloud Shell.

- You are now going to Edit Permissions for your pixel.

- Add User Permissions to the pixel. In the Add users field, enter allUsers. In the Select a role list, select Reader.


The Google Cloud Storage Bucket setup is now completed.
1.2. Create a Google Cloud Load Balancer
You now have a Cloud Storage Bucket with a single, invisible, publicly accessible pixel. Next, you set up a way to log all the requests made to the bucket by creating an HTTP Load Balancer in front of that bucket.
You are also going to set up a Custom Domain (ex. gtm-monitor.yourdomain.com) with your DNS provider.
- Start Configuring your Load Balancer. Select HTTP(S) Load Balancing.

- Give your Load Balancer a Name.

- In the Backend Configuration, choose Create a Backend Bucket.

- In the Backend Bucket settings, give it a short and relevant name, then browse for and select the bucket you created earlier. Also make sure to select the “Enable Cloud CDN” option before you click the “Create” button.

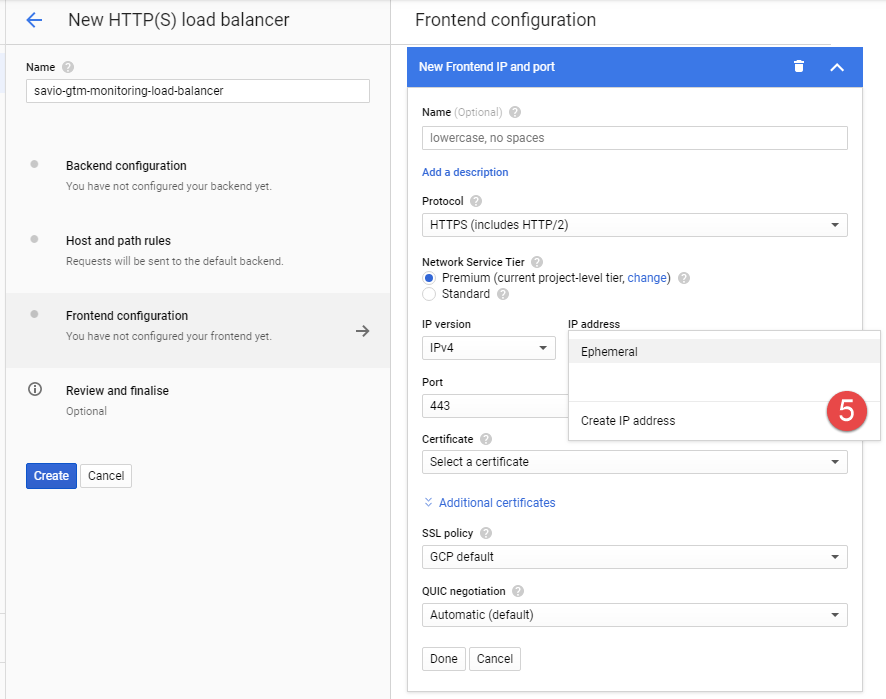
- Skip the Host and path rules section as the defaults are fine, and move on to the Frontend configuration section. Here you need to ensure the “HTTPS” protocol is selected, and from the IP address dropdown select the “Create IP address” option. You can also choose IP version.

- In the Reserve a new static IP address setting, give your IP address a relevant Name, and click Reserve.

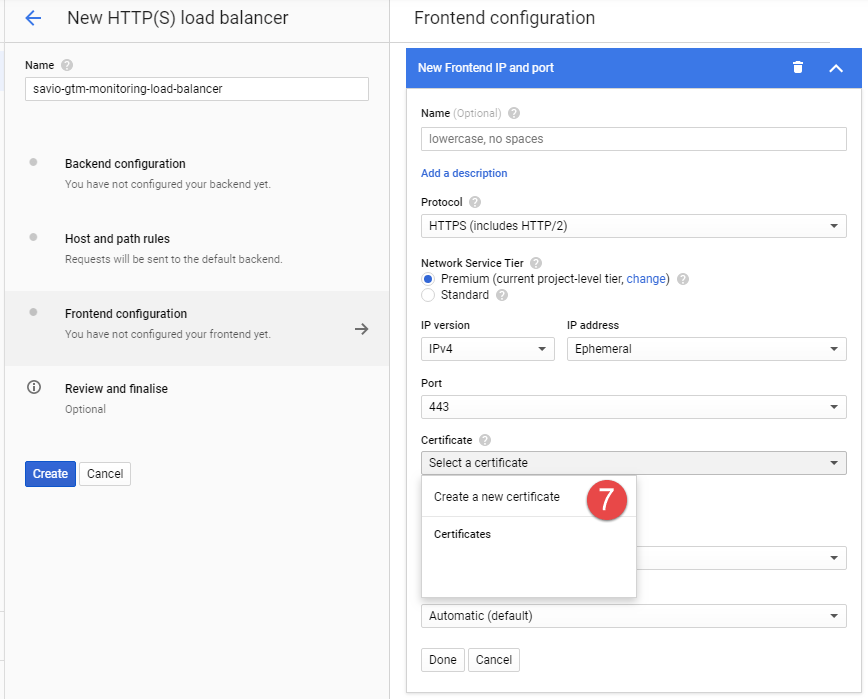
- Our Load Balancer frontend is going to handle HTTPS traffic, so it needs a SSL Certificate. Click Create a new certificate.

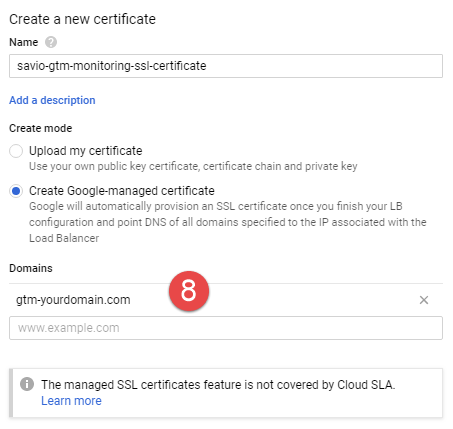
- In the Create a new certificate settings, you can either upload your own certificate, or use a Google Managed Certificate. I’m using a Google Managed Certificate. Enter a relevant Name for your certificate, and select Create Google-managed certificate. In the Domains setting, add the custom domain you want to use for the CDN that fronts your tracking pixel. Click the Create button at the bottom of the page, to save the new certificate.

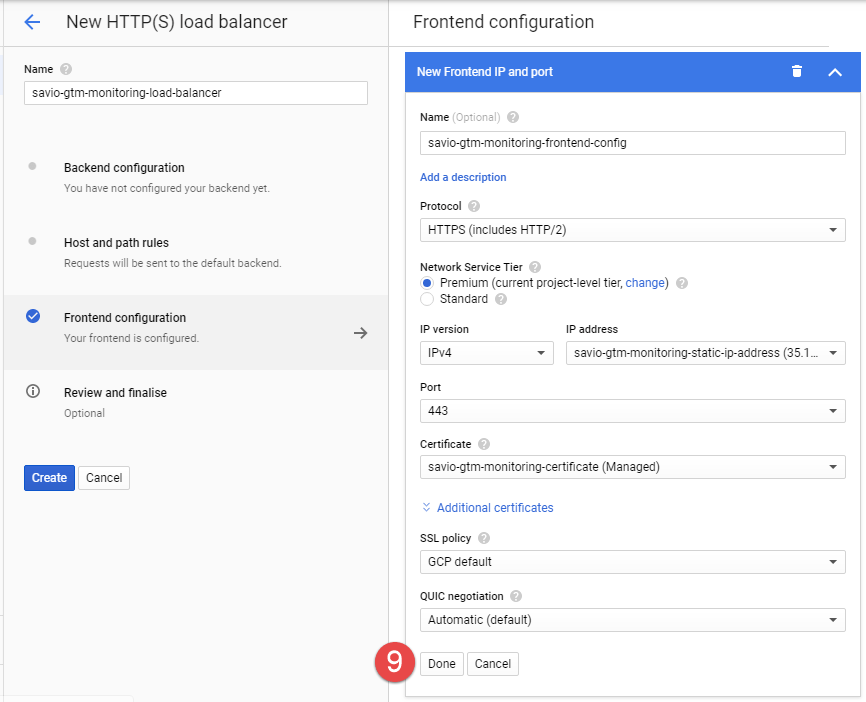
- Click Done button to finalize the HTTPS frontend settings.

- Review the settings. If everything looks good, click Create. The load balancer and certificate will then start provisioning.


The Load Balancer setup is now completed.
It can take a some time for the certificate in particular to provision, so while you wait, head over to your web host, and set up your custom domain using the IP address that you reserved in the Load Balancer setup. The interface for creating a CNAME record varies from one DNS provider to another, but here is mine.

2. Google Tag Manager setup
While you wait for your DNS to propagate, head over to Google Tag Manager, and edit the Google Tag Manager Monitor Template and Tag.
2.1. Google Tag Manager Monitoring Tag Template
Edit the Allow URL Match Patterns so it reflects your Custom Domain. It should be in this format:
|
1 |
https://yoursubdomain.yourdomain.com/pixel.png* |

2.2. Google Tag Manager Monitoring Tag
In your GTM Monitoring Tag, edit the Get request endpoint.
|
1 |
https://yoursubdomain.yourdomain.com/pixel.png |

Now run GTM in Preview mode, and check the Network tab in the Browser Console.

When status 200 is returned, your DNS is updated, and you can publish your changes in GTM.
3. Google Cloud setup – Part 2
You GTM Monitoring data have now started to flow into Google Cloud. The next step is to get the data into BigQuery.
3.1. Stackdriver Logging Export
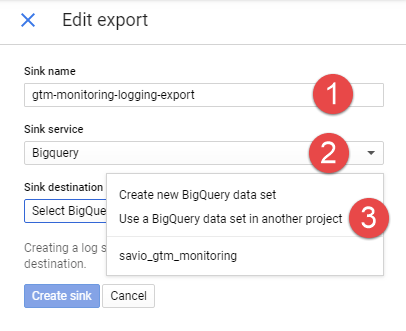
Head over to Stackdriver Logging, and you should see your GTM Monitoring data. Click Create Export.

Give your Stackdriver Logging Export a useful Sink name (1), select BigQuery as Sink service (2), and choose Sink destination (3). Either create a new BigQuery dataset, or choose an existing dataset (like the one you have already created for your GTM Monitor project).
3.2. BigQuery
The BigQuery Table Name will be in the format requests_YYYY-MM-DD, and is predefined. Table Schema is also predefined, and contains more information than you need for this project (since it contains the complete log from Stackdriver).

3.2.1. Make a BigQuery View or Data Studio Custom Query
The next step is to make this data available in a useful format. You can either parse the data into a BigQuery View, or if Data Studio is your next step, you you can run the SQL code in a Data Studio Custom Query Connector.
Remember to replace your-project.your_dataset in the FROM part of the query with your project and dataset name.
Do also notice that this query is using a Table Wildcard Function, which means that you will make a query against all the data in the table if you run this query. Since BigQuery is a paid tool, you may want to limit the query, or use other cost savings methods.
|
1 2 3 4 5 6 7 8 9 10 11 12 13 14 15 16 17 18 19 20 21 22 23 24 25 26 27 |
SELECT timestamp, eventName, eventTimestamp, (SELECT REGEXP_EXTRACT(tagString, "&tag\\d+id=([^&]+)")) as tagId, (SELECT REPLACE(REGEXP_EXTRACT(tagString, "&tag\\d+nm=([^&]+)"), "%20", " ")) as tagName, -- Simple replace of Encoded White Space (SELECT REGEXP_EXTRACT(tagString, "&tag\\d+st=([^&]+)")) as tagStatus, (SELECT REGEXP_EXTRACT(tagString, "&tag\\d+et=([^&]+)")) as tagExecutionTime FROM ( SELECT timestamp, eventName, eventTimestamp, tagStringUnnest as tagString, pt FROM ( SELECT timestamp, (SELECT REGEXP_EXTRACT(httpRequest.requestUrl, "eventName=([^&]+)")) as eventName, (SELECT REGEXP_EXTRACT(httpRequest.requestUrl, "eventTimestamp=([^&]+)")) as eventTimestamp, (SELECT REGEXP_EXTRACT_ALL(httpRequest.requestUrl, "&tag\\d+id=[^&]+&tag\\d+nm=[^&]+&tag\\d+st=[^&]+&tag\\d+et=[^&]+")) as tagStringRegex, DATE(timestamp) as pt FROM `your-project.your_dataset.requests_*` ) LEFT JOIN UNNEST(tagStringRegex) as tagStringUnnest ) |
Although you can run the SQL Query above directly in Data Studio using a Custom Query, it’s recommended to modify the query a little bit. BigQuery parameters can optimize query cost and dashboard performance. Thanks to my colleague Simen André Hansen for the tip. Below is a query like this illustrated. Only the last part of the query is shown.
|
1 2 3 4 5 6 7 |
.... FROM `your-project.your_dataset.requests_*` WHERE _TABLE_SUFFIX BETWEEN @DS_START_DATE AND @DS_END_DATE ) LEFT JOIN UNNEST(tagStringRegex) as tagStringUnnest ) |
4. Some Final Words
This Google Cloud setup is inspired by the Google Cloud tutorial How to do serverless pixel tracking.
Although this isn’t described in this blog post, I’ve made some adjustment to the original GTM Monitor Template. I only send data if the GTM Event contains a Tag. I do also track some more information, as shown in my Tag Monitoring settings below:

- Track GTM Container ID: Sometimes it can be useful to track the Container ID. Ex. if you are using Google Tag Manager (360) Zones.
- Track Page URL: To identify if Tags are triggered on the correct pages, Page Path can be of value. If the GTM Container is handling several domains, the Hostname can be useful to track.
You find the Adjusted GTM Monitoring Template below.
For other tracking and analysis of your GTM Container, take a look at the blog post GTM Monitor 2.0 by Doug Hall.
If you think anything could be improved, please leave a comment.
4.1. Adjusted GTM Monitoring Template
|
1 2 3 4 5 6 7 8 9 10 11 12 13 14 15 16 17 18 19 20 21 22 23 24 25 26 27 28 29 30 31 32 33 34 35 36 37 38 39 40 41 42 43 44 45 46 47 48 49 50 51 52 53 54 55 56 57 58 59 60 61 62 63 64 65 66 67 68 69 70 71 72 73 74 75 76 77 78 79 80 81 82 83 84 85 86 87 88 89 90 91 92 93 94 95 96 97 98 99 100 101 102 103 104 105 106 107 108 109 110 111 112 113 114 115 116 117 118 119 120 121 122 123 124 125 126 127 128 129 130 131 132 133 134 135 136 137 138 139 140 141 142 143 144 145 146 147 148 149 150 151 152 153 154 155 156 157 158 159 160 161 162 163 164 165 166 167 168 169 170 171 172 173 174 175 176 177 178 179 180 181 182 183 184 185 186 187 188 189 190 191 192 193 194 195 196 197 198 199 200 201 202 203 204 205 206 207 208 209 210 211 212 213 214 215 216 217 218 219 220 221 222 223 224 225 226 227 228 229 230 231 232 233 234 235 236 237 238 239 240 241 242 243 244 245 246 247 248 249 250 251 252 253 254 255 256 257 258 259 260 261 262 263 264 265 266 267 268 269 270 271 272 273 274 275 276 277 278 279 280 281 282 283 284 285 286 287 288 289 290 291 292 293 294 295 296 297 298 299 300 301 302 303 304 305 306 307 308 309 310 311 312 |
___INFO___ { "displayName": "Google Tag Manager Monitoring", "description": "A template for setting up tag monitoring in Google Tag Manager.", "__wm": "VGVtcGxhdGUtQXV0aG9yX0dvb2dsZS1UYWctTWFuYWdlci1Nb25pdG9yLVNpbW8tQWhhdmE=", "securityGroups": [], "id": "cvt_temp_public_id", "type": "TAG", "version": 1, "brand": { "displayName": "", "id": "brand_dummy" }, "containerContexts": [ "WEB" ] } ___TEMPLATE_PARAMETERS___ [ { "help": "Provide the URL to which the GET request with tag data is sent.", "alwaysInSummary": true, "valueValidators": [ { "type": "NON_EMPTY" }, { "args": [ "^https://.+" ], "errorMessage": "The endpoint must be a valid URL", "type": "REGEX" } ], "displayName": "GET request endpoint", "simpleValueType": true, "name": "endPoint", "type": "TEXT", "valueHint": "e.g. https://track.com/collect" }, { "help": "If you select <strong>No</strong>, details of all the tags that fired for any given hit are sent in a single GET request. If you select <strong>Yes</strong>, you can choose the maximum number of tags per request, and the tag will automatically send multiple requests if necessary.", "displayName": "Batch hits", "simpleValueType": true, "name": "batchHits", "type": "RADIO", "radioItems": [ { "displayValue": "No", "value": "no" }, { "displayValue": "Yes", "help": "", "value": "yes", "subParams": [ { "help": "Enter the maximum number of tags per request that will be dispatched to the endpoint. If necessary, multiple requests will be made.", "valueValidators": [ { "type": "POSITIVE_NUMBER" } ], "displayName": "Maximum number of tags per request", "defaultValue": 10, "simpleValueType": true, "name": "maxTags", "type": "TEXT" } ] } ] }, { "displayName": "More Choices", "name": "moreChoicesGroup", "groupStyle": "ZIPPY_CLOSED", "type": "GROUP", "subParams": [ { "help": "Track GTM Container ID. Can be useful if you are sending data from different GTM Containers.", "enablingConditions": [], "displayName": "Track GTM Container ID", "simpleValueType": true, "name": "gtmID", "type": "RADIO", "radioItems": [ { "displayValue": "Yes", "value": "yes" }, { "displayValue": "No", "value": "no" } ] }, { "help": "Track Page URL where the Tag was executed. Choose which part of the URL you want to track using checkboxes below.", "displayName": "Track Page URL", "name": "urlTracking", "type": "GROUP", "subParams": [ { "help": "Track HTTP(S) Protocol", "simpleValueType": true, "name": "protocol", "checkboxText": "Protocol", "type": "CHECKBOX" }, { "help": "Track Hostname (www.example.com)", "simpleValueType": true, "name": "hostName", "checkboxText": "Hostname", "type": "CHECKBOX" }, { "help": "Track Page Path (/example/page-path)", "simpleValueType": true, "name": "pagePath", "checkboxText": "Page Path", "type": "CHECKBOX" }, { "help": "Track Query String (?id=123¶m=example). Query Strings can sometimes contains PII, so it's recommended to not track Query Strings to avoid trouble.", "simpleValueType": true, "name": "queryString", "checkboxText": "Query String", "type": "CHECKBOX" } ] } ] } ] ___WEB_PERMISSIONS___ [ { "instance": { "key": { "publicId": "read_data_layer", "versionId": "1" }, "param": [ { "key": "keyPatterns", "value": { "type": 2, "listItem": [ { "type": 1, "string": "event" } ] } } ] }, "clientAnnotations": { "isEditedByUser": true }, "isRequired": true }, { "instance": { "key": { "publicId": "send_pixel", "versionId": "1" }, "param": [ { "key": "urls", "value": { "type": 2, "listItem": [ { "type": 1, "string": "https://yoursubdomain.yourdomain.com/pixel.png*" } ] } } ] }, "clientAnnotations": { "isEditedByUser": true }, "isRequired": true }, { "instance": { "key": { "publicId": "read_event_metadata", "versionId": "1" }, "param": [] }, "isRequired": true }, { "instance": { "key": { "publicId": "get_url", "versionId": "1" }, "param": [ { "key": "urlParts", "value": { "type": 1, "string": "any" } } ] }, "isRequired": true } ] ___SANDBOXED_JS_FOR_WEB_TEMPLATE___ /* GTM Monitor Template by Simo Ahava: https://www.simoahava.com/analytics/google-tag-manager-monitor/ Adjustments made by Eivind Savio: https://www.savio.no/google-tag-manager/gtm-monitoring-google-cloud-pixel-tracking Adjustments: * Track GTM Container ID * Track protocol, Hostname, Page Path and Query String * Only track GTM Events that contains Tags */ // Require the necessary APIs const addEventCallback = require('addEventCallback'); const readFromDataLayer = require('copyFromDataLayer'); const sendPixel = require('sendPixel'); const getTimestamp = require('getTimestamp'); const query = require('queryPermission'); const getUrl = require('getUrl'); // Get the dataLayer event that triggered the tag const event = readFromDataLayer('event'); // Add a timestamp to separate events named the same way from each other const eventTimestamp = getTimestamp(); const endPoint = data.endPoint; const batchHits = data.batchHits === 'yes'; const maxTags = data.maxTags; const gtmID = data.gtmID === 'yes'; // Page URL const protocol = data.protocol ? getUrl('protocol') : ''; const hostName = data.hostName ? getUrl('host') : ''; const pagePath = data.pagePath ? getUrl('path') : ''; const queryString = data.queryString ? getUrl('query') : ''; const pageURL = '&protocol=' + protocol + '&hostName=' + hostName + '&pagePath=' + pagePath + '&queryString=' + queryString; // Utility for splitting an array into multiple arrays of given size const splitToBatches = (arr, size) => { const newArr = []; for (let i = 0, len = arr.length; i < len; i += size) { newArr.push(arr.slice(i, i + size)); } return newArr; }; // The addEventCallback gets two arguments: container ID and a data object with an array of tags that fired addEventCallback((ctid, eventData) => { // Filter out the monitoring tag itself const tags = eventData.tags.filter(t => t.exclude !== 'true'); // If batching is enabled, split the tags into batches of the given size const batches = batchHits ? splitToBatches(tags, maxTags) : [tags]; // Track GTM Container ID const containerId = gtmID ? ctid : ''; // For each batch, build a payload and dispatch to the endpoint as a GET request batches.forEach(tags => { let payload = '?eventName=' + event + '&eventTimestamp=' + eventTimestamp + '&containerId=' + containerId + pageURL; tags.forEach((tag, idx) => { const tagPrefix = '&tag' + (idx + 1); payload += tagPrefix + 'id=' + tag.id + tagPrefix + 'nm=' + tag.name + tagPrefix + 'st=' + tag.status + tagPrefix + 'et=' + tag.executionTime; }); if (tags.length){ // Track only GTM Events that contain Tags sendPixel(endPoint + payload, null, null); } }); }); // After adding the callback, signal tag completion data.gtmOnSuccess(); ___NOTES___ Created on 11/07/2019, 09:11:59 |
4.1.1. Adjusted BigQuery SQL
If you use the template above, you may want to adjust your BigQuery SQL so it includes the extra data added.
|
1 2 3 4 5 6 7 8 9 10 11 12 13 14 15 16 17 18 19 20 21 22 23 24 25 26 27 28 29 30 31 32 33 34 35 36 37 38 39 40 41 42 |
SELECT timestamp, eventName, eventTimestamp, containerId, protocol, hostName, pagePath, queryString, (SELECT REGEXP_EXTRACT(tagString, "&tag\\d+id=([^&]+)")) as tagId, (SELECT REPLACE(REGEXP_EXTRACT(tagString, "&tag\\d+nm=([^&]+)"), "%20", " ")) as tagName, (SELECT REGEXP_EXTRACT(tagString, "&tag\\d+st=([^&]+)")) as tagStatus, (SELECT REGEXP_EXTRACT(tagString, "&tag\\d+et=([^&]+)")) as tagExecutionTime FROM ( SELECT timestamp, eventName, eventTimestamp, containerId, protocol, hostName, pagePath, queryString, tagStringUnnest as tagString, pt FROM ( SELECT timestamp, (SELECT REGEXP_EXTRACT(httpRequest.requestUrl, "eventName=([^&]+)")) as eventName, (SELECT REGEXP_EXTRACT(httpRequest.requestUrl, "eventTimestamp=([^&]+)")) as eventTimestamp, (SELECT REGEXP_EXTRACT(httpRequest.requestUrl, "containerId=([^&]+)")) as containerId, (SELECT REGEXP_EXTRACT(httpRequest.requestUrl, "protocol=([^&]+)")) as protocoL, (SELECT REGEXP_EXTRACT(httpRequest.requestUrl, "hostName=([^&]+)")) as hostName, (SELECT REGEXP_EXTRACT(httpRequest.requestUrl, "pagePath=([^&]+)")) as pagePath, (SELECT REGEXP_EXTRACT(httpRequest.requestUrl, "queryString=([^&]+)")) as queryString, (SELECT REGEXP_EXTRACT_ALL(httpRequest.requestUrl, "&tag\\d+id=[^&]+&tag\\d+nm=[^&]+&tag\\d+st=[^&]+&tag\\d+et=[^&]+")) as tagStringRegex, DATE(timestamp) as pt FROM `your-project.your_dataset.requests_*` ) LEFT JOIN UNNEST(tagStringRegex) as tagStringUnnest ) |
Happy analysing your GTM Container Tags using Google Cloud Serverless Pixel Tracking.
Leave a comment