
In this blog post I share how you can create a Google Data Studio Dashboard for your Jaguar I-Pace Trips. If you own a Jaguar fossil car, you will have to do some changes to the dashboard, but you should be able to build upon this example.
Do also check out my 2 other related blog posts:
- How to Download your Jaguar InControl Trips to Google Sheets
- In this blog post I share how you can download your Jaguar InControl Trip Data to Google Sheets through the Jaguar InControl API. This blog post is built upon that blog post, and you have to complete that setup first.
- Jaguar InControl API for Google Sheets – Part 2
- Here I explain what information you get about your trips, which part of the Jaguar InControl API I use, and the Google Apps Script code.
So what is Google Data Studio?
Data Studio turns your data into informative reports and dashboards that are easy to read, easy to share, and fully customizable.
And it’s free!
Updates
- 27.02.2019:
- Added Custom Calculation of Avg. Consumption Adjusted.
1. Make a Copy of the Jaguar I-Pace Dashboard example
- Open the “Data Studio Dashboard example”, and create a copy
- Menu: “File -> Make a copy…”

After you have created a copy, you need to connect the Data Studio Dashboard to the Jaguar InControl Trips Google Sheets.
2. How to Connect Data Studio to Google Sheets
You can connect Data Sources to Google Data Studio on different levels:
- Connect individual Graphs and Tables to a Data Source
- Connect a Data Studio Page to a Data Source
- Connect a Data Studio File to a Data Source
We are going to use the last method. This means that the Data Source will be used automatically for graphs and tables that you insert into the Dashboard. To use the last method:
- Menu: “File -> Report settings”

Report Settings are shown to the right in your screen.
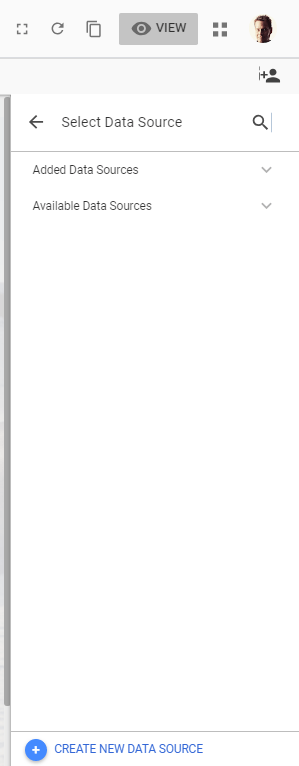
- Click on “Select Data Source”.
- Then at the bottom of Select Data Source column, click “Create New Data Source”.

Now you are taken to an overview for different “Google Connectors”.
- Scroll down, find “Google Sheets”, and select that connector.
After you have selected “Google Sheets” as the connector, do the following:

- Find your “Jaguar InControl Trips” Google Sheet
- Select the “Jaguar InControl Trips” Worksheet
- Give a meaningful name to the Connector
- Connect Data Studio to the Connector
The last step is to Add to Report as shown below.

If everything have worked as it should, you should now see that you Jaguar I-Pace Trips Dashboard in Google Data Studio is filled with your own trip data.
But, you will also notice 2 errors.

This is because you will have to create a Custom Calculation of Average Consumption.
Custom Calculation of Average Consumption
If you have looked closer to the Google Sheet, and what kind of data we have there, you are maybe wondering what I’m talking about. In the sheet we have a column called Avg. Consumption, but here I tell you that you have to create a Custom Calculation of Average Consumption?
The Average Consumption value in the sheet, is the average of that specific trip. If you want the Average Consumption across trips, you can’t use that value, since it will not take Distance into considerations.
Follow the instructions below to create the Custom Calculation of Average Consumption.
1. Create New Field
In Edit mode in Data Studio, in the bottom right corner, click Create New Field.
You should now get a Formula Field in Data Studio as shown in the image below.

In the Formula Field, add the calculation below.
|
1 |
SUM(Energy Consumption)/SUM(Distance)*AVG(Consumption Calculation Value) |
Add a Field Name. I have called this value “Avg. Consumption Adjusted”.
Click Save, and go back to your Data Studio Dashboard.
Whenever you need an Average Consumption value that spans across several trips, use the Avg. Consumption Adjusted value . If you need the Average Consumption value for individual trips (like in the Table in the Dashboard), you can use the value from the Google Sheet.
About the Jaguar I-Pace Trips Dashboard
The dashboard looks like the image below, and contains only 1 page. If you want several pages with other calculations and numbers, you can do that.

Some of the functionality in the dashboard are:
- Date Selector
- Standard setup for the Date Selector is showing last 28 days (not including today)
- Search for Start Address or End Address
- Graphs are interactive, so if you click on a data point, the report will automatically be narrowed down to that data point
- Click on the data point again to go back to “normal”
- You can edit the text / headlines for the different numbers and graphs if you want that.
You can also do much more in Google Data Studio; like blending Data Sources, creating new Data Fields and Calculations, adding Filters and more. Check out Google Data Studio help texts for more information.
Some Closing Words
The Jaguar I-Pace Data Studio Dashboard is in no way a product of Jaguar or related to Jaguar. I’m just a happy Jaguar I-Pace owner that happens to work with data, and thought it was great fun to create this Google Data Studio Dashboard for my own Jaguar I-Pace.
Happy driving and analyzing your Jaguar I-Pace!
Thank you Mr. Savio for this series of posts! A very solid example of taking control of personal data and using for your own insight and enjoyment. This will be added to the Google Data Studio resource finder!
Thank you for that.
Regards,
Eivind